The PSPA Tech Formula Presentation Enhancement helps administrators give members a beautifully tailored pension benefit calculation narrative.
Overview
Pension Administrators need to effectively communicate how a benefit was calculated. The explanation must be clear, concise, and precise. A clear, conversational tone and familiar summary plan document-like format will improve the audience’s comprehension. A concise story can be constructed by conditionally eliminating calculation rules that don’t apply to the member’s situation. The member’s data and intermediate calculation result values can be woven into the story to provide a tailored explanation.
The story should be accessible in whole or in part in various convenient ways. Administrators may use it to review calculations, train other administrators, and explain calculations to members via phone, email, letter, or member portal.
Equally important, the story should be easily configured with an intuitive confluence of the underlying calculation parameterization, the formula presentation configuration, and the story’s presentation. It should be easy to improve the story configuration when needed. Configuration capabilities should be powerful enough to add almost any member or calculation data elements without customizations but provide a clear path for customization if necessary.
Existing calculation results pages and worksheets primarily show a labeled list of values but do not clearly connect them or adequately describe how and why they were resolved.
Hypothesis
What if system users and members could see calculation results in a clear, understandable format instead of a confusing list of calculation result values?
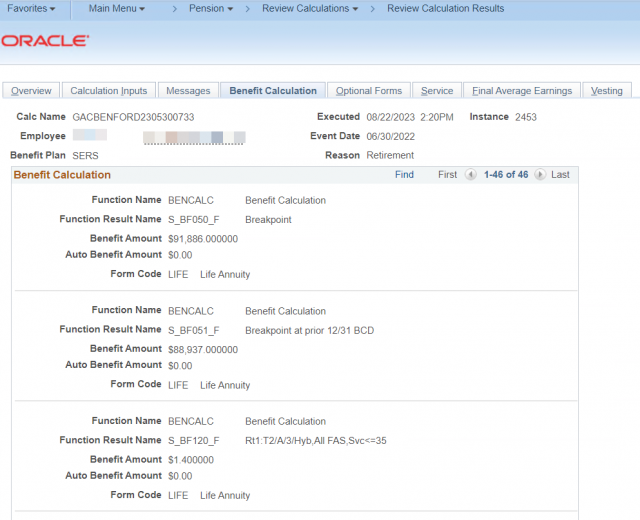
The Calculation Results Benefit Formula page displays a list of values without showing how they are connected.
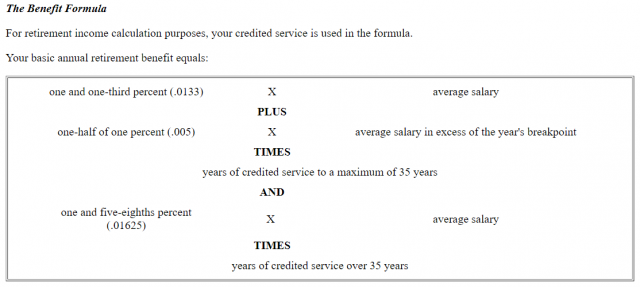
Meanwhile, the member may have reviewed the Summary Plan Document (SPD) and learned about the benefit formula.
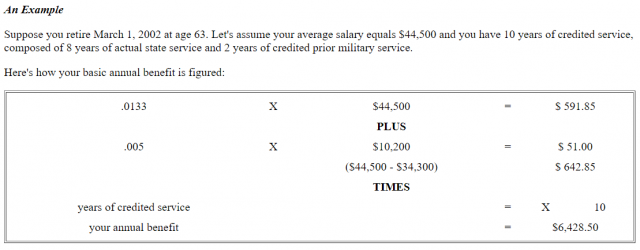
In the SPD, the member may also see an example calculation and wonder what their benefit will be.
Sometimes, additional complications, such as a union-negotiated formula change, might impact the member’s benefit calculation.

The confluence of the SPD, the implemented plan rules, the member’s data, and the Formula Presentation enhancement and configuration can effectively explain the member’s benefit calculation tailored to their situation.
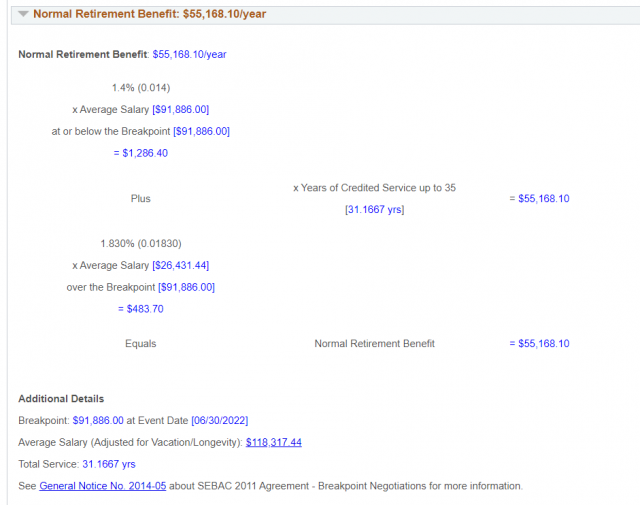
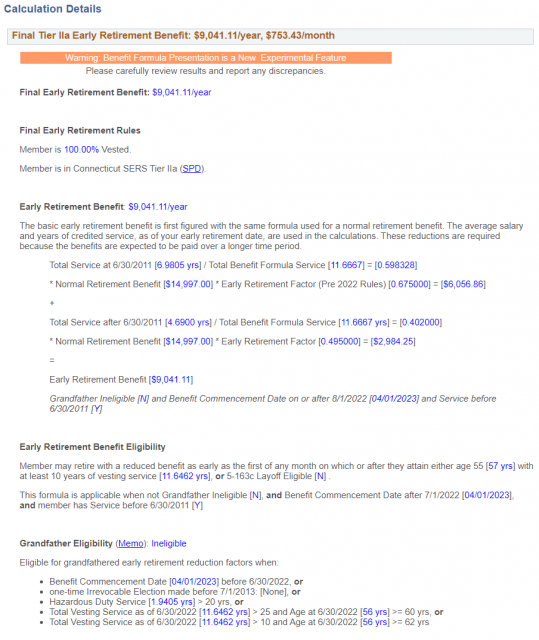
Notice the appropriate formula has been displayed with details that don’t apply intentionally absent, such as the benefit addition for members with more than 35 years of service.
Solution
The Formula Presentation enhancement stands on three pillars:
- An improved calculation process saves additional details when executing the calculation. This assists with accurately identifying the configured rules applied to determine the member’s benefit.
- A robust Formula Presentation configuration capability to enable telling a vivid story with variable substitutions, text formatting options, conditional logic programming, and syntax validation.
- A new Calculation Overview page to display resolved Formula Presentation components that make up the whole story. There is also an option to customize and download a PDF version of the story.
Calculation Overview
The Calculation Overview page, with all sections collapsed, offers a high-level summary of important member and calculation details.
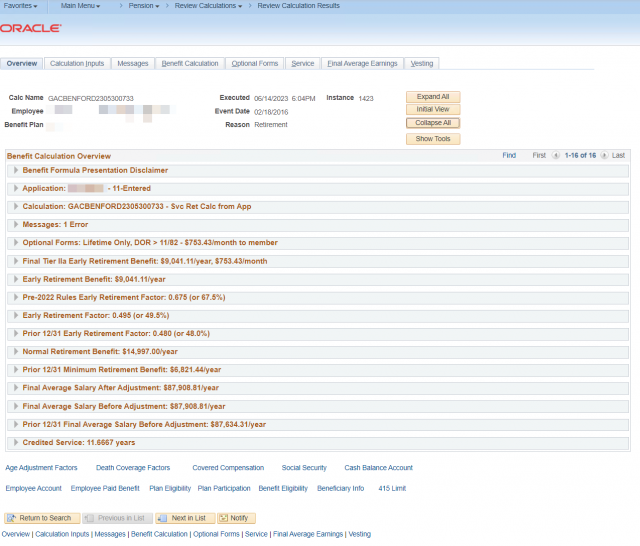
Generally, a section will be displayed if the underlying primary function result definition applies to the member’s case. Additionally, a section can be configured to be conditionally hidden, usually because the section doesn’t apply to the member. The order in which the sections are presented is also configurable.
Each section can be configured to expand or collapse by default or based on conditional logic. This allows the most important formula components to catch the viewer’s attention first.
The header for each section can be configured to include important summary details, making the story’s chapters clear even when all sections are collapsed.
The chapter details are presented when a section is expanded. If collected, the member’s optional form election can display details for only the selected form or provide details on all forms when absent.

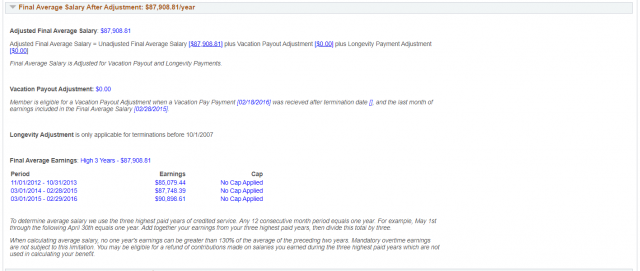
In these examples, a convention has been adopted to display member-specific values in blue text. These values are retrieved from the calculation results when the page is displayed. The other text describes the formula or business rules behind how this part of the benefit is calculated using sentences instead of labeled lists of numbers. The rule implementor configures this text using the tools included in the enhancement.
The Final Average Earnings (FAE) results can be presented with the applicable earnings periods and applicable earnings caps and adjustments.
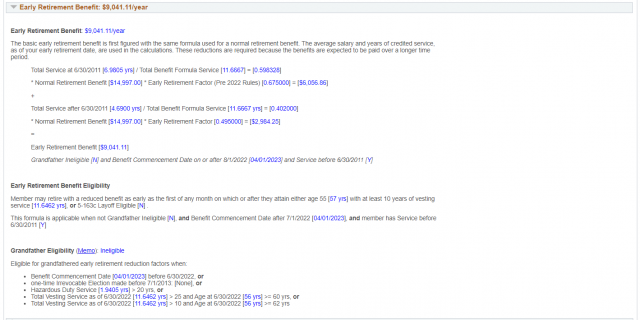
The Early Retirement Benefit can be presented with the mathematical benefit formula and details on how the member qualified for this benefit.
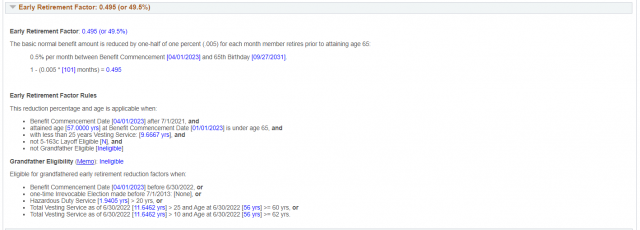
We can present details on how the Early Retirement Factor (ERF) was computed and how the member qualified for the particular ERF method.
Each section’s text can easily be copied and pasted to an email or document. A feature to extract the complete story to an XML/PDF for download is planned.
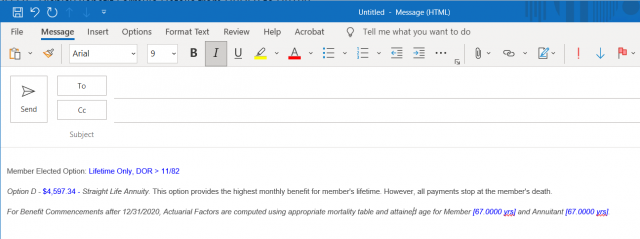
Download Formula Presentation Report
A Download button on the Calculation Overview page allows users to quickly extract the Formula Presentation page to a distributable PDF file.
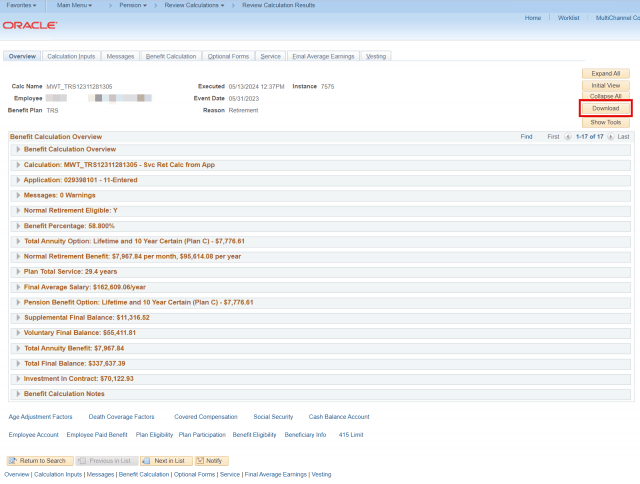
The report is generated for any expanded sections on the page and always includes a configured header and footer formula presentation. Sections can be expanded or collapsed using the section arrows or the Expand All, Initial View, or Collapse All buttons.
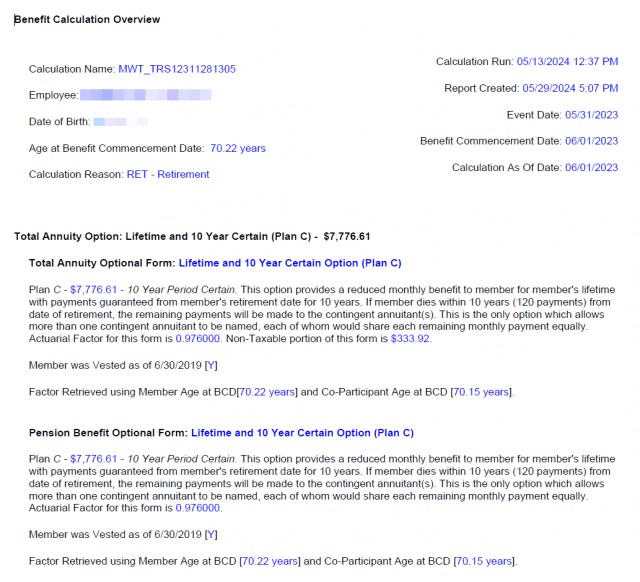
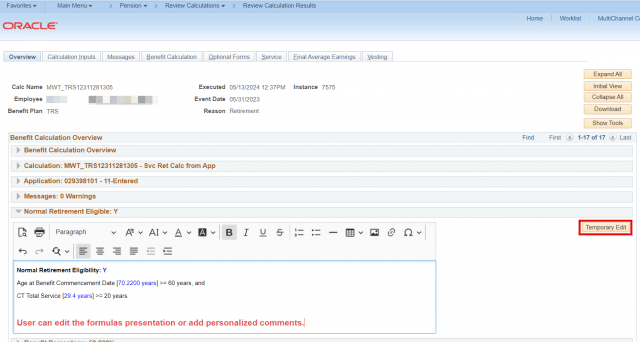
The user can customize the report by editing the sections before downloading using the Temporary Edit button and the rich text editor it enables.
The Show Tools and Temporary Edit buttons enable the user to change the sort order of the sections included in the report.

Popup/Secondary Pages
Another option for making the Formula Presentation available to the user is to customize pages that display result values with links to view related formula details.
Below is a Custom page that shows a benefit calculation summary. The displayed amounts have been converted to hyperlinks that open a secondary page with the related details.

Clicking on one of these blue hyperlinks in the grid displays a secondary page with the Formula Presentation.
In this case, the configuration design for the formula presentation centered around providing extensive details for each of these four values.
A pop-up window for formula presentation can also be used. A pop-up window appears when the user places the cursor over the result value displayed in the Tools section.

Story Guidelines
The goal is to tell all or part of the calculation story aligned with the member’s calculation results:
- The story is different for each member – specific to the definitions applied during the member’s calculation.
- The story includes general plan rule information and specific values from a member’s data/calculation – no more lists of values without context.
- The story should look good, organized, understandable, and easy to read.
- The story should be complete and not require extensive jumping from tab to tab to research or review.
- The story can be altered for different audiences, such as a Pension Analyst, HR Representative, or Member.
- The story can include anchors and links to jump around to related details.
- The story can include internal PeopleSoft Links to review or edit related data.
- The story can include External Links to access published plan rule information or other content.
- The story should not include overly technical details such as Function Result or Alias Names.
Configuration
To best introduce the design principles behind the Formula Presentation enhancement, let’s look at the evolution of tools provided by PeopleSoft to generate calculation worksheets and correspondence.
Tools Evolution
The earliest worksheets and letters used SQR to create a PDF report or a comma-delimited file with member and calculation data, which was then used by the Microsoft Word mail merge capability to create a nicely formatted letter.
The next technological evolution introduced creating an XML file using Application Engine programs (or PS Query) and generating a nicely formatted report or letter using BI Publisher.
The challenges with both solutions include:
- Custom development is required to extract member data and calculation results. Pension Application expertise is required to identify the best data sources for a particular functional requirement.
- Results are displayed outside of the Application. Several steps are required to get results.
- Changing the results requires development or template modifications. Slow iterations cause frustration.
Formula Presentation
The Formula Presentation enhancement uses:
- Rich Text Format Long Text Fields are to enter configuration, storing the formatted text to be published, variable substitutions, and simple conditional logic. This is like the RTF, PDF, or DOC templates used by the Word/BI Publisher approaches.
- A PeopleCode run-time engine to evaluate conditional logic and substitute variables before results are displayed. This is like the Mail Merge and BI Publisher tools, but instead of generating a document, the results are returned in an updated text field that can be displayed on a page or passed to a process.
- The PeopleCode run-time engine retrieves the values to be substituted directly from the database, based on configuration parameter names or pre-defined common pension data sets, rather than through a separate data extraction step developed in SQR or Application Engine.
Formula Presentation Benefits
Benefits of this design include:
- Ability to tell a tailored benefit calculation story through configuration only.
- Combining the data extraction and template setup steps into one configuration field.
- Requires no programming to access delivered calculation results referenceable by parameter name. Requires less, if any, programming to access custom data elements.
- Robust configuration tools to process conditional logic, data variable substitution, data set presentation, numeric value formatting, combining multiple formulas, and much more. More details can be found in the Formula Presentation Configuration user guide.
- Includes validation tools to confirm correct syntax is used and provide feedback where issues are identified.
- Robust formatting tools, including font type/size/color selection, table formatting, hyperlinks, images, and more.
- Easy to integrate into new/existing pages. Ability to put formula presentation results at the user’s fingertips by easily adding pop-up/secondary pages that display a resolved story segment upon mouseover or click of a displayed result value.
- Quick configuration feedback loop via tools available to configurators directly from the Calculation Overview page.
The Formula Presentation Configuration page collects instructions for presenting the calculation details.
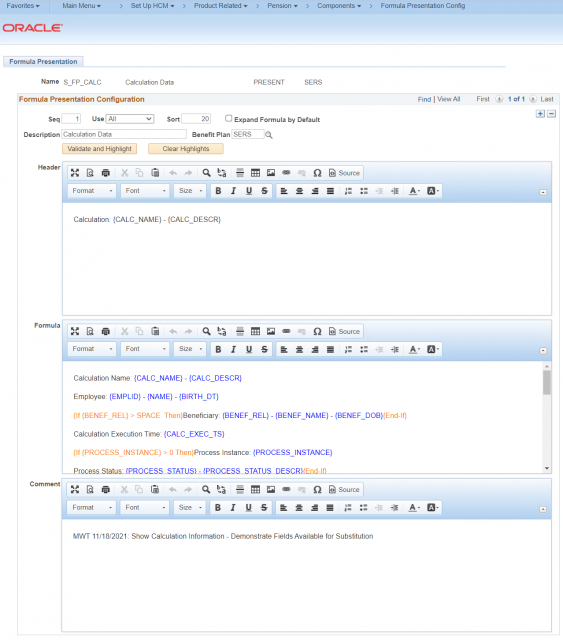
The text fields that capture the Formula Header and Detail instructions can be expanded to full-screen mode for easier editing.
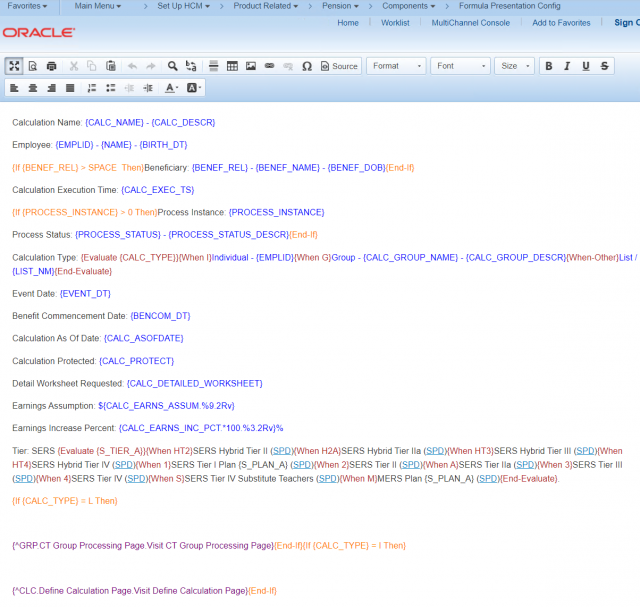
The elements within braces identify variables or instructions to be processed by the run-time engine. Colorful highlighting makes the instructions easier to identify.
The run-time engine evaluates the formula configuration, substitutes variables with member and calculation data, and processes other included instructions.

Configurations can also include data sets containing multiple rows to populate tables in the Formula Presentation.
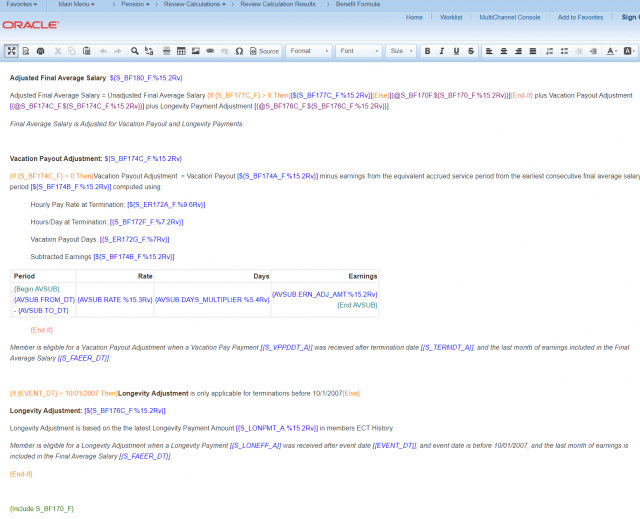
Configuration Feedback Loop
Users granted access to the configuration page can opt to see a Tools section with additional details and direct links to edit the configuration. Simple click refresh after return to see the result of changes almost instantly.

Quick fix loop involves:
- Click Show Tools
- Click Edit
- Make Edits
- Click Save
- Close Window
- Click Refresh Section
Contrast this quick fix loop with a typical XML/BI Publisher change loop
- Open an Issue / Define Requirements
- Assign Developer
- Modify XML Generator (Application Engine Program)
- Modify RTF/PDF Template and Upload
- Test
Prerequisite Updates
Enhancements to the COBOL Calculation Process were needed to record additional intermediate results and tell a story tailored to the member’s specific situation.
The Calculation must have been run with these Prerequisite Updates implemented to display Formula Presentations completely and correctly. Historical Calculations will return a warning like this:

Store Applicable Groups and Definitions
Enhancement to store the applicable Function Result Groups and Definition timeline to new CT_PA_CLC_GRP_A table. This capability is required to tell a tailored story based on the specific definitions used to compute a member’s benefit.
Store Function Result Values
Enhancement stores Function Result results in the CLC_ALS_VAL table to make retrieving any Function Result for Formula Presentation substitution easier. Function Result results are still written to the CLC_VAL_DEC, CLC_VAL_CHAR, and CLC_VAL_DATE tables.
Store Custom Statement Temporary Variable Assignments
Enhancement captures Custom Statement assignments, including temporary variables when the calculation is run, and stores them in a new table to be included in Formula Presentation variable substitutions. Sometimes, the data needed to present the details of the benefit calculation story are only resolved as temporary aliases. In addition, assignments can occur at multiple points in a Custom Statement depending on which IF statement condition is met, so it may be useful to know in which row the assignment took place when constructing the story.
Store Database Alias Defaults
Customizations allow a default value to be assigned to Database Aliases when the primary record and field do not return a value. A fix was implemented to capture the defaulted value in the CLC_ALS_VAL table for accurate Formula Presentation substitution.
Group Processing Table Lookup Alias As Of Date
A fix has been put in place to ensure Table Lookup Aliases are resolved using the correct As Of Dates, which may include the calculation input on the Custom Group Processing page when applicable.
Leave a Reply
You must be logged in to post a comment.